Taverna 1 Screenshots
Example workflow

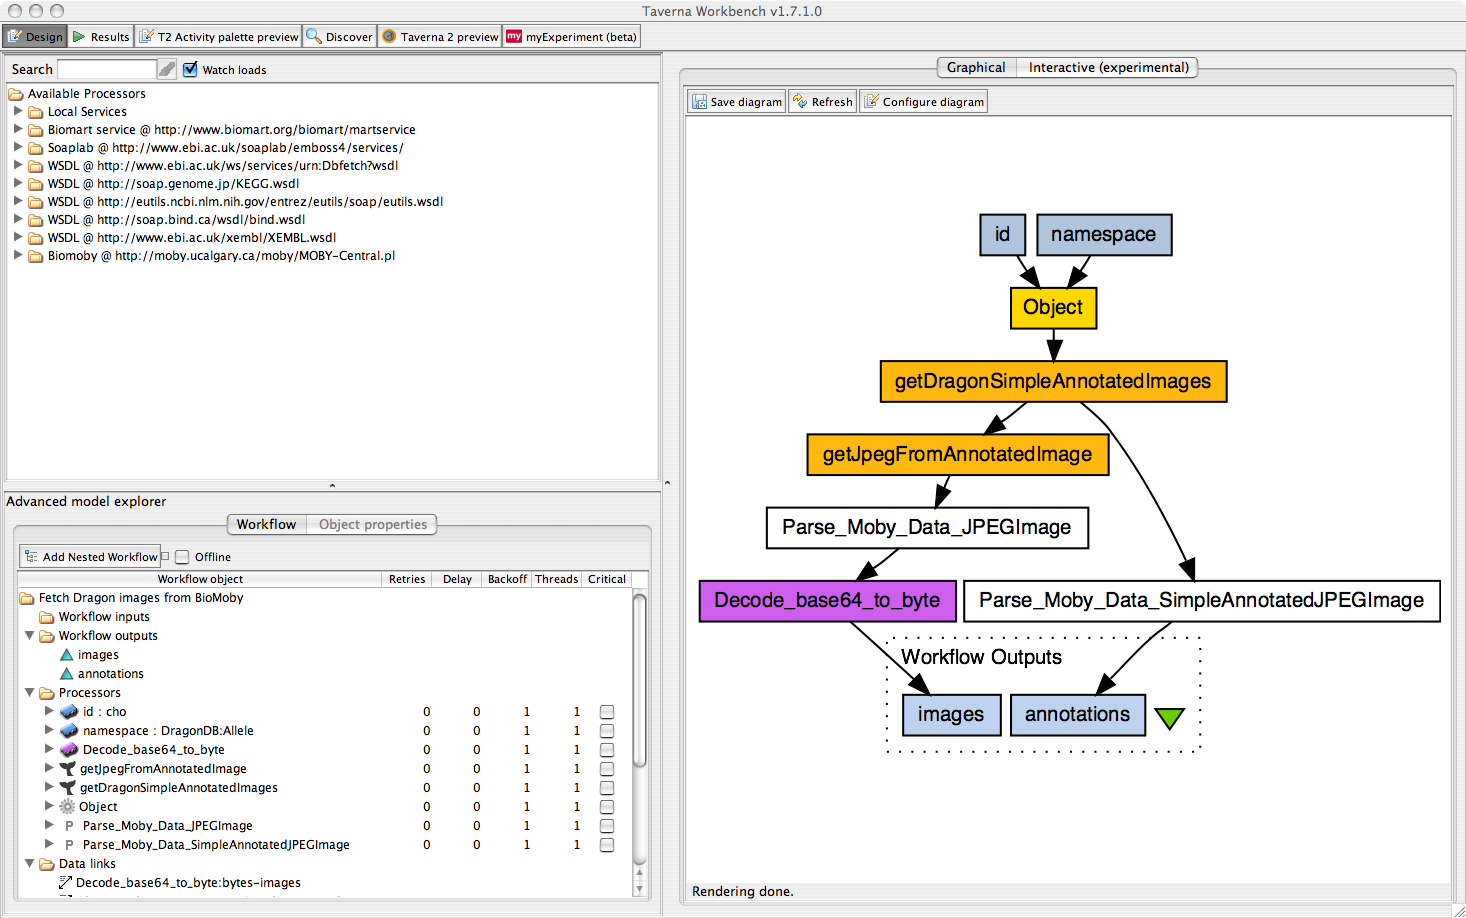
An example workflow in Taverna showing:
- the service palette of services loaded by the user in the top left
- the tabular description of the workflow in the bottom left
- a graphical representation of the workflow on the right
Exploring myExperiment to find a workflow
- browse packs in myExperiment to find suitable workflow
- load a workflow into to run or edit
- include a workflow in the user’s current workflow
Running a workflow
- A tabular form of the workflow run at the top
- A graphical form of the workflow at the bottom
- Green rectangles represent completed calls of services
- The yellow part of the purple rectangle shows the proportion of calls to the service that have been completed
- Grey rectangles represent services yet to be called
- Light blue rectangles with upward-pointing triangles represent outputs – workflows can, of course, also have inputs
Example workflow result
- The left show the seven results present for the chosen output (images)
- The right shows the rendering of a particular result


