This component provides a read only configurable view of the workflow in graphical form. Workflow inputs, outputs and processors appear as coloured boxes with arrows between them to represent data and control links. Options are available to configure the layout and level of detail shown and the resultant diagram may be saved to disc in a number of different formats. It is intended to allow a quick visual overview of the structure of a workflow.
Taverna 1.3 onwards has a view driven by an underlying Scalable Vector Graphic (SVG) representation along with the ability to display nested workflows inline in the main diagram.
The toolbar consists of two sets of items.
Save Diagram ... as
Dot format text
Portable Network Graphics format image
Scalable Vector Graphics format image
Postscript (PS)
Postscript for PDF
Refresh
Configure Diagram
All saved files will have the same layout, port display, alignment and type display as the current visible image. They will not, however, be scaled in any way. The various options are to save as dot format text (the native format used internally and by GraphViz from AT&T research), PNG image (a bitmap graphic format suitable for web pages, Word documents etc) and SVG (a vector graphic format, preferable if you have tools such as Adobe Illustrator which can work with it as there is no loss of detail from scaling, particularly suitable therefore for posters).
Selecting any of the save options will display a file chooser in a format appropriate to your operating system. You will need to add the appropriate file extension yourself, saving dot files as .text, png as .png and svg as .svg appropriately.
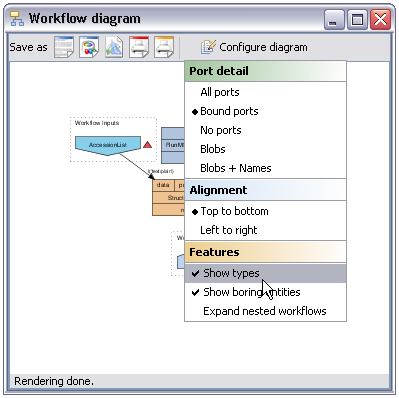
The appearance of the diagram is controlled from the 'Configure diagram' drop down menu.
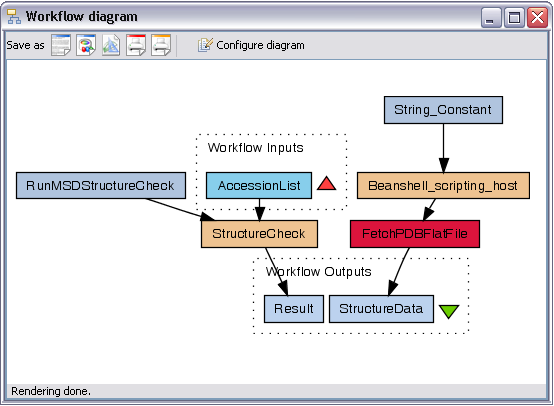
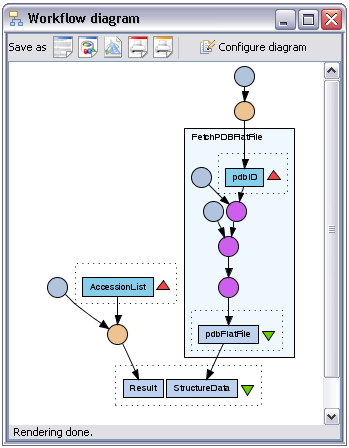
This checkbox determines whether the diagram should include information about the MIME types and collection structures being transferred between processors in the workflow. The image below shows the diagram panel displaying a workflow with no port information, vertical layout and no types.
If the 'Show types' checkbox is selected the display changes to the following:
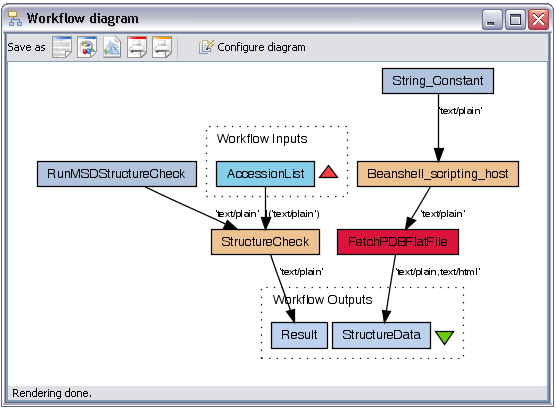
Each solid dark arrow (a data link) has two types. The upper of these is the type of information flowing out of the output of the processor the link is from, the lower that of the input the link is to. In most cases these will be identical, for example in the case of the link between processors 'RunMSDStructureCheck' and 'StructureCheck' the type is plain text at both ends of the link. If the input and output types are the same Taverna will only display the string once. If they are radically different (i.e. requiring iteration or aggregation) they will be displayed in red.
A nested workflow processor represents a workflow as a component within a higher level workflow. In the diagram above the red processor is a workflow in its own right - to show the contents of this workflow inline within the diagram you should check the 'Expand nested workflows' option in the diagram configuration. The view should change to something like the following:
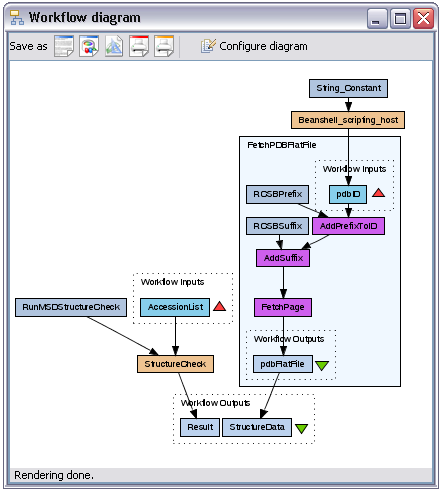
With large workflows the diagram displays can become unwieldy. One partial solution is to mark a subset of the processors, particularly those with no scientific impact upon the workflow, as boring. These can then be hidden in the diagram and workflow enactment status views leading to a simpler graph. Processors can be flagged as boring or not by right clicking on the processor concerned in the model explorer and selecting the appropriate option. The diagram views have acquired an additional check box, if the 'show boring' option is deselected those processors flagged as such will not appear. Note that by default string constants are marked as boring:
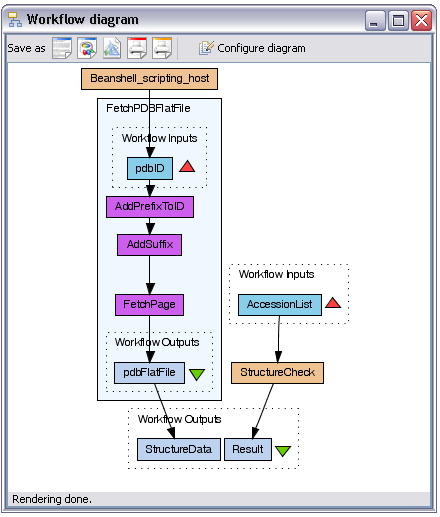
Diagram views can have one of five settings for port display. The two images above were generated with no ports shown; this is useful to get a view of the overall structure of the workflow. It is not possible to see exactly where the data links are connecting - the processors 'RunMSDStructureCheck' and the workflow input 'AccessionList' both feed into 'StructureCheck' but there is no indication as to which inputs they connect to. This additional information can be enabled by selecting either 'All ports' or 'Bound ports' from the drop down list:
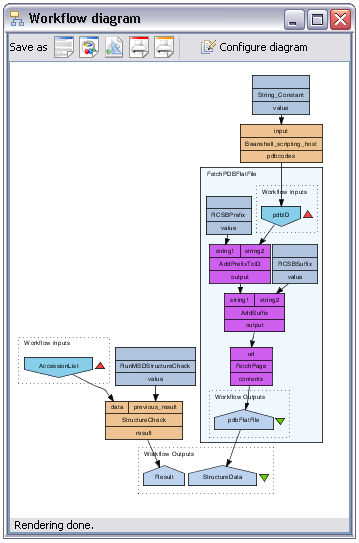
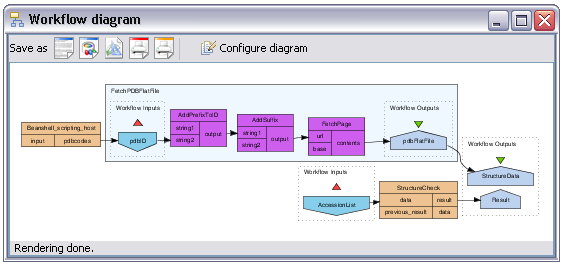
Data links now connect explicitly to particular inputs and outputs, in this vertical view the outputs of each processor are below the processor name and the inputs above. The 'Bound ports' view shows only ports which are the subject of a data link. Switching to the 'All ports' view shows all processor inputs and outputs whether used or not. This view is often rather unwieldy when processors have upwards of forty inputs (this is not uncommon). For layout reasons the default alignment switches to 'Horizontal' when this is selected.
The unused port 'previous_result' on 'StructureCheck' is now visible.
The two 'blob' options hide more information, not only do they not display input and output port names but they also hide names of processors. Using the 'Blobs' option results in something resembling art deco, we suggest that the 'Blobs + names' is probably more useful! This will only show the names of nested workflows (if expanded), workflow inputs and outputs, and processors which have either no inputs or no outputs (and are therefore probably interesting). An example is shown below:
The default alignment shows workflow inputs at the top of the diagram, outputs at the bottom with data therefore always flowing from top to bottom. For some diagram views the layout is better with data flowing from left to right, this can be selected by choosing the 'Horizontal' alignment option from the drop down menu.
By default when you generate a diagram it will be scaled to the available space. You can pan and zoom around the figure by holding shift and dragging to pan, ctrl and drag the mouse to zoom (keys apply to Windows version). To regenerate the scaled display you can select the same port option again, this will force a regeneration of the interface and scale the diagram to the available space. This replaces the 'Fit to window' option (not to mention being a lot faster) and is also used for the SVG result renderer.
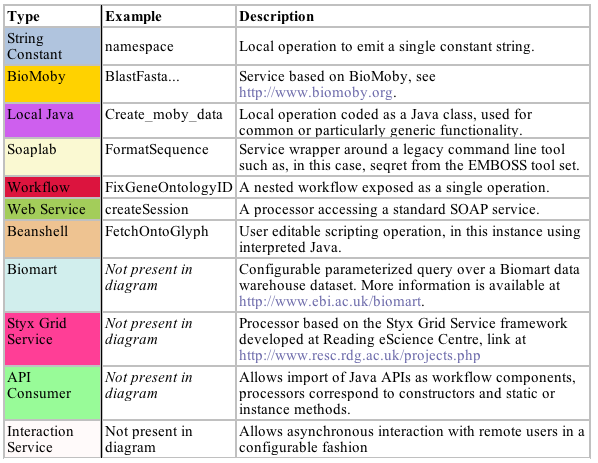
Colour is used both in the diagram and explorer views to denote the service architecture behind each processor. The diagram below shows a workflow including examples of each different processor type (excluding the biomart based operations):
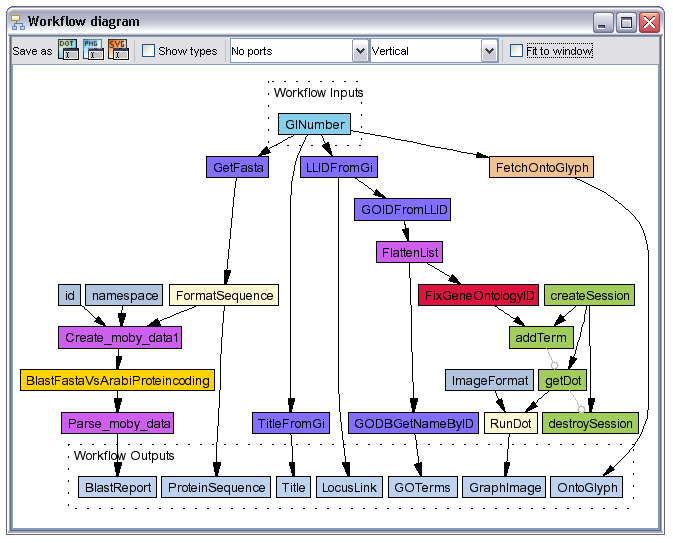
The eight different processor types in this workflow (and four not shown) are as follows: