The Enactor Launch Panel (ELP) allows the user to enter input data for a workflow then launch the workflow enactor with that data. It is only shown if the workflow requires some input, if the workflow has no user specified inputs this panel is never shown and the enactment status display in the results view is shown directly.
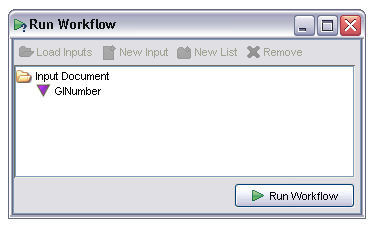
The image below shows the initial state of the ELP when a workflow with one input called 'GINumber' is enacted:
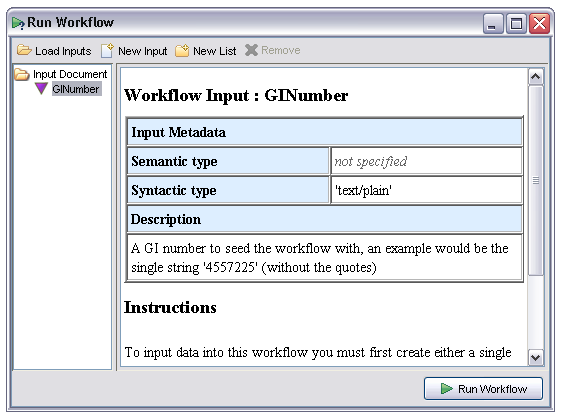
The user selects the input from the tree and a new pane appears showing any workflow input metadata specified when the workflow was created in the AME. In this case this includes a free text description and MIME type:
To create a new value for this input the user selects the 'New Input' or 'New List' options from the toolbar. These allow the user to respectively create a new single input or a new collection. Inputs in Taverna are either single items or collections, collections in turn containing either single items or other collections but never both. This constraint is enforced in the input panel. Suppose the user wishes to specify a list of GI numbers as input for this workflow, he or she clicks on the 'New List' button then three times on the 'New Input' button to create three textual items within the list. The individual items initialise with a default textual value:
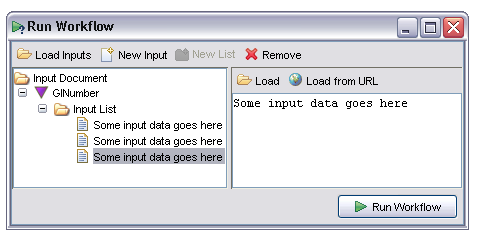
For textual data the value may be entered directly into the pane on the right of this window. For textual or binary data the data may also be loaded directly from a file (the 'Load' option) or URL (the 'Load from URL' option). Binary data such as images may only be loaded from these buttons. The text input area will be disabled in these cases.
Multiple inputs within a list may be loaded from a collection of files by selecting the 'Load Inputs' option from the toolbar. This then prompts the user to select one or more files on disk and loads the contents of each file into a separate data item. This is useful if you have a directory containing a large set of input files, much faster than creating and loading each one individually.
Input data items may be removed by selecting the item and clicking on the 'Remove' button in the toolbar.
Internally Taverna uses an XML representation of the entire set of inputs. This representation may be viewed by selecting the 'Input Document' node in the tree. The display looks something like the following:
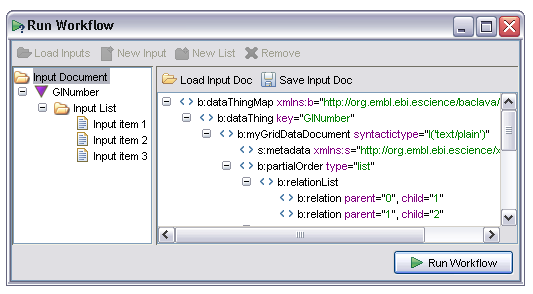
The exact contents of the XML view are unimportant at this point. It is potentially useful, however, to save the entire input document for later re-use, in particular when a workflow is failing on certain input sets. The document may be saved in XML form from the 'Save Input Doc' and reloaded from the 'Load Input Doc' option.
Once all inputs have been defined the workflow may be enacted by clicking the 'Run Workflow' button at the bottom right of the window.
The Enactment Status Panel (ESP) in the results view shows the current progress of a workflow invocation. It displays results to the user for browsing and handles storage of those results to local or remote data stores in a variety of formats. It appears when the user invokes a workflow; in the case of workflows with user defined inputs it appears after the user has entered any input data into the ELP, otherwise it appears immediately. There are three main tabs shown at different stages during and after a workflow enactment:

This tab, which is active all the time during and after a workflow enactment and performs two roles. Firstly it shows a summary of the current state of each processor. This is displayed in a table, with one row per processor. The columns indicate processor type, name, current status, the time the status last changed and any additional information:
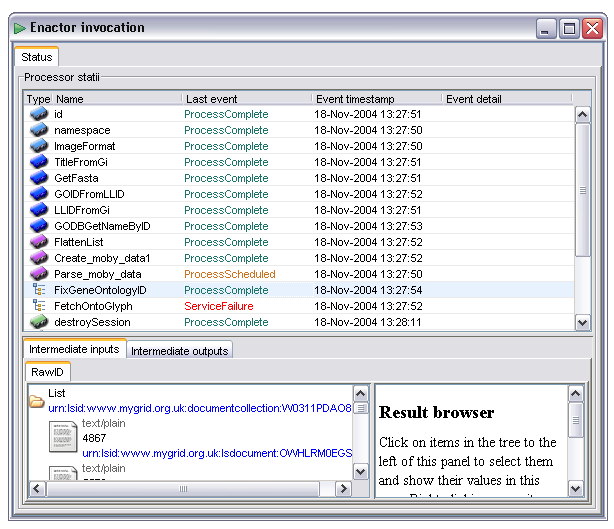
The Last event field shows the most recent state change of the specified processor. All processors start with the ProcessScheduled state. When all the dependencies for a processor are satisfied (all data available and any control links activated) the processor is transitioned to the 'Invoking' state or 'InvokingWithIteration' In the case of iteration occurring over the inputs to that processor. In the event of failure the processor will potentially go to any of 'WaitingToRetry', 'AlternateScheduled' or 'ServiceFailure' states depending on how fault tolerance is configured. The state diagram under the basic fault tolerance section gives more details of the possible states in graphical form, the events correspond to states in that diagram.
Some events, especially 'InvokingWithIteration' carry additional information which is conveyed in the Event detail column. In the case of iteration this shows the number of iterations that are expected and the index of the current one.
The second role of the status display is to allow the user to inspect intermediate inputs and outputs of individual processors both during and after a workflow invocation. This is especially helpful to determine the reasons for abnormal workflow operation (such as a processor failing) or to check that the data is really what the user expects when designing the workflow.
To inspect the inputs and outputs of a given processor the user selects the processor in the status table. The inputs and outputs (if present, a process which is still scheduled will have neither, one which is invoking or failed will have no outputs) are then displayed in tabs below the status table. This part of the display is identical to the result browser in functionality.
The Results tab is activated once the workflow has completed. It is automatically selected when this happens, meaning that very fast running workflows may never display the workflow status tab (although it can always be manually selected). This section allows the user to view both individual result items and any collection structures such as lists in which they occur. The output for a sample workflow is shown below:
This display shows three named outputs. These correspond to workflow outputs defined in the AME when the workflow was created. Note that if a particular part of the workflow has failed some output tabs may not be present, only outputs which contain results are displayed here.
To show an individual result the user selects it from the panel on the left of the result display. This then displays that item in the panel to the right using the default renderer for that data type. A sequence alignment is shown in the example above.
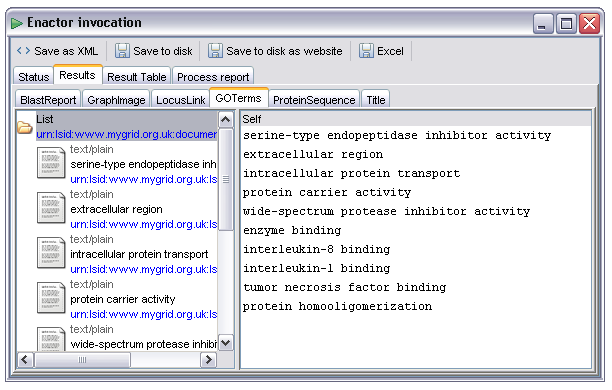
Some outputs will contain more than one result. In the example below the 'GOTerms' output contains a list of plain text items. As these items are relatively short the actual values are shown in the left hand panel, individual items could be selected as in the example above but in addition the list itself can be selected. In this case the right hand panel will attempt to display all the items in a list, as these items are all textual this looks like a single document containing one item per line:
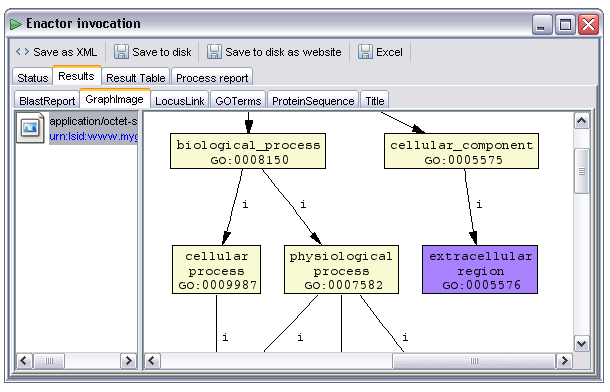
Workflows may output binary data in various forms. Provided the correct MIME types are specified for the workflow output the renderer selection mechanism will by default select an appropriate renderer component. In the example below the output 'GraphImage' has been selected. This output has been annotated with the 'image/png' MIME type from the AME's output metadata editor. As a result the default renderer is one that can understand and display images:
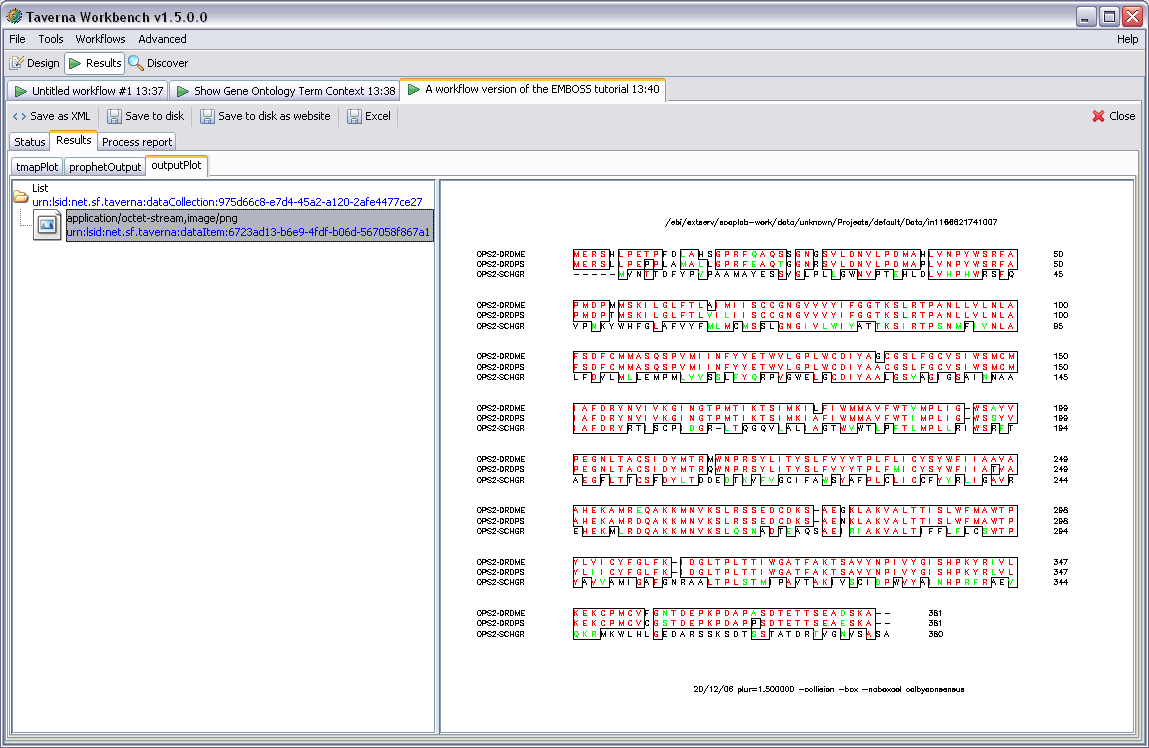
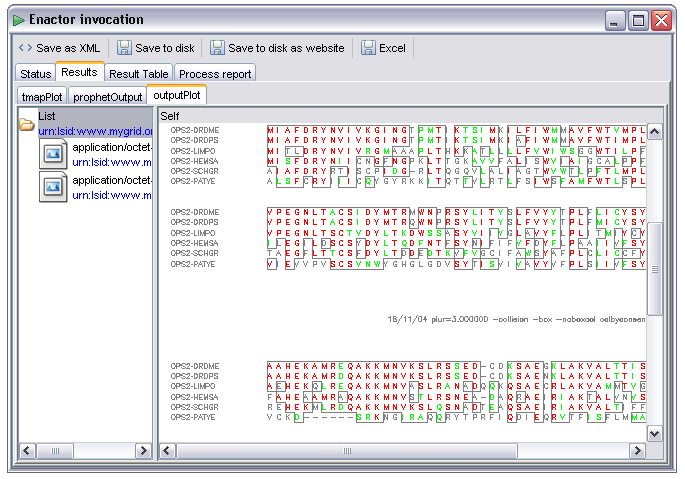
As with textual items collections of images (or other binary data) are also handled, the following image is from a workflow using the EMBOSS tools - these generate lists of images corresponding to pages of output, in this case from the 'plot' tool rendering a multiple sequence alignment:
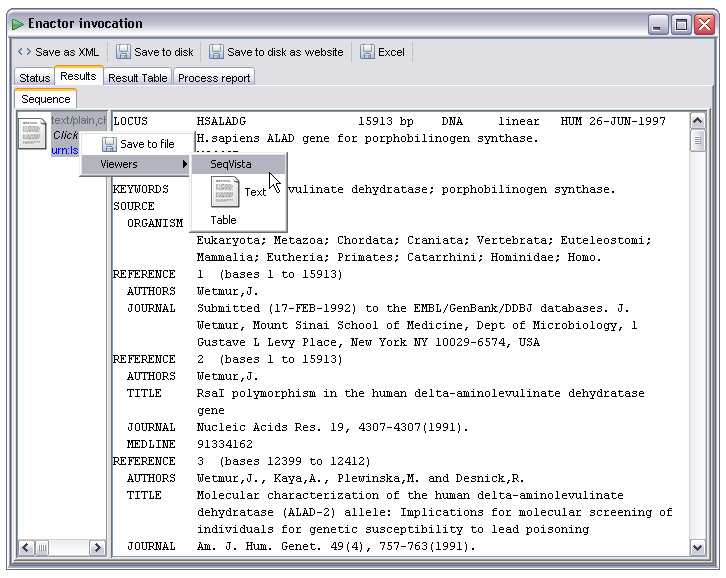
In some cases there may be multiple available renderers for the data item. For example, all the 'text/....' types can be rendered as plain text. There are several which may also be rendered in some more specific way as well, for example as an XML tree or rich text format document. The example below shows a Genbank record displayed as text. If, however, the user right clicks on the data item he or she is presented with a menu offering other rendering options:
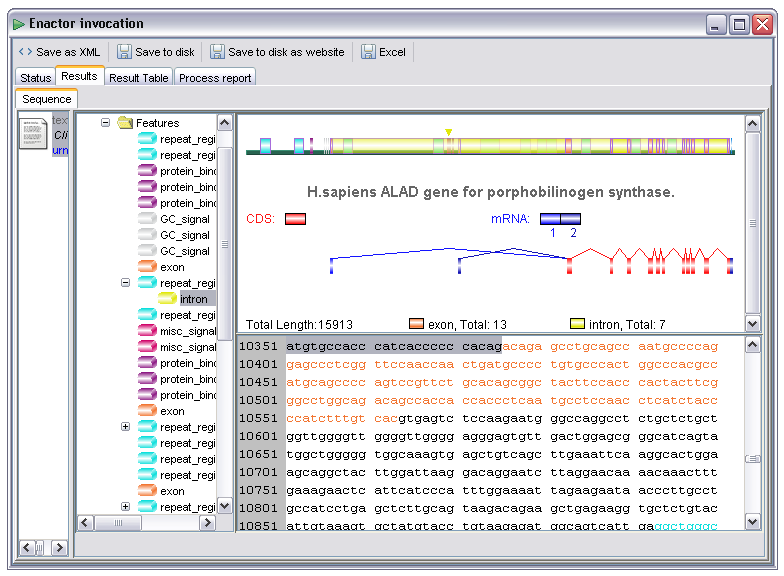
By selecting the SeqVista renderer the user is then presented with a much more friendly display. This renderer is an embedded instance of the SeqVISTA tool (http://zlab.bu.edu/SeqVISTA/) and is used to display a variety of sequence file formats:
The SeqVista renderer is currently attached to the chemical/seq-aa-genpept, chemical/seq-na-genbank, chemical/x-swissprot, chemical/x-embl-dl-nucleotide and chemical/x-ppd MIME types.
Another custom renderer based on the Jmol structure renderer. By flagging an output as chemical/x-pdb or chemical/x-mdl-molfile the user can cause the output to be passed to an interactive 3d visualiser. Although the MIME type is suggestive of PDB flatfile format output this can be used to force the use of Jmol for other formats that application can handle, more details of which are available at http://www.jmol.org. The renderer within Taverna is based on the current pre v10 build of Jmol, a screenshot of the '1pdb' molecule is shown below. The user can manipulate the 3d visualization in the normal way within this panel:
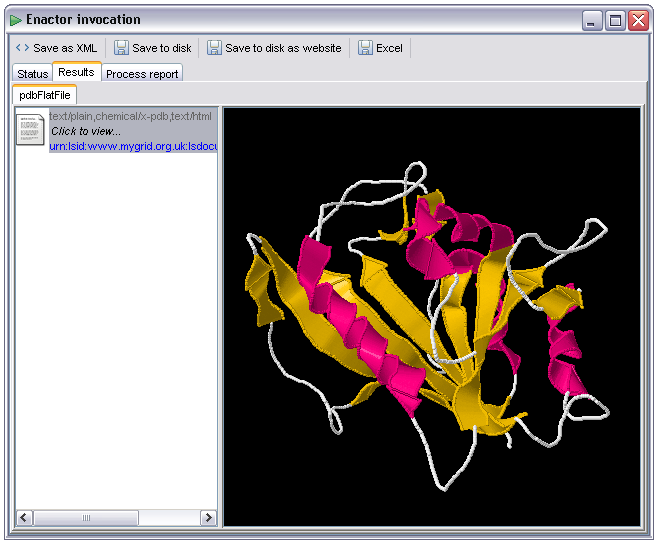
For molecules over 300 atoms the display shown above is used, this corresponds to the following RasMol script:
wireframe off; spacefill off; select protein; cartoon; colour structure;
select ligand; spacefill; colour cpk; select dna; spacefill 0.4;
wireframe on; colour cpk;
Where there are fewer than 300 atoms (small molecules, ligands, cheminformatics apps) a different script is used:
select *; spacefill 0.4; wireframe 0.2; colour cpk;
Results may be saved to disk either as single items or as entire result sets.
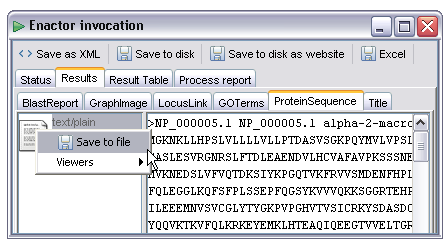
Single result items may be saved by right clicking on the item and selecting 'Save to file' from the context menu:
The 'Save as XML' button allows the entire result set to be stored as a single XML document. This can be reloaded into the data viewer tool (included with the workbench distribution) and could be regarded as the master data format. Files in this format allow the entire result display panel to be reproduced, including the various other export options and metadata such as data item LSIDs. When selected this prompts the user for a location for the save file. The XML file produced is not intended to be human readable!
The 'Save to disk' button allows the user to save all data items into a directory structure on the local disk. This is effectively the same as selecting all items individually and using the 'Save to file' option on each one with the additional feature that it handles collections such as lists. The user is prompted for the name of a new directory into which all workflow results are stored. In the case of single items the results are saved as files with the filename being derived from the output name, in the case of collections a new directory is created under the top level result directory with the name of the workflow output. Items within the collection structure are then created with names generated from numbers starting at zero. An example output directory show in the Windows XP explorer would look like this:
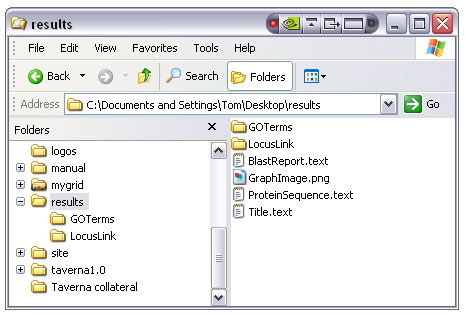
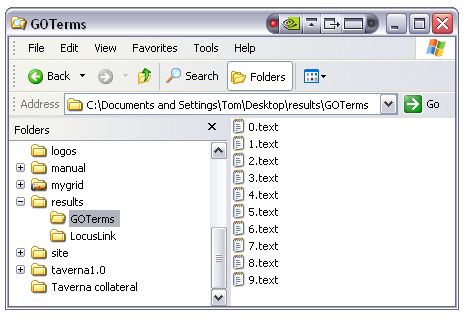
The single items 'BlastReport', 'GraphImage', 'ProteinSequence' and 'Title' have been created as files with the appropriate file extensions (guessed from the MIME types) with the two lists 'GOTerms' and 'LocusLink' created as directories. Opening the 'GOTerms' folder shows the individual list items as distinct files:
Note that as most services run under UNIX variant operating systems the text files are likely to have UNIX line endings, opening them with Notepad will generally result in a garbled mess, Wordpad or Emacs will work better. This only applies to Windows users, Linux and Solaris users should use whatever text editor is available on their installation.
The 'Excel' button allows the export of all textual results up to two dimensions (maximum depth of collections is a list of lists of text) to a single Excel spreadsheet. When selected the user is prompted for the name of an Excel file (extension .xls). This is more or less meaningful depending on the workflow. An example workflow which emits a list of GO terms and their descriptions might produce an output such as the following in Excel:
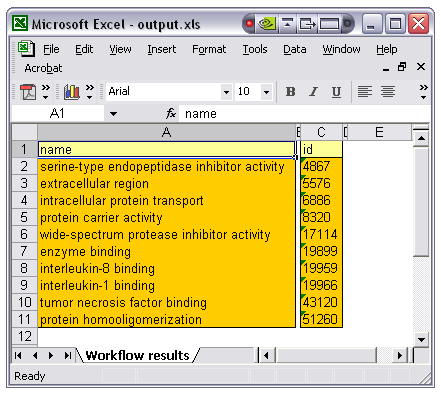
In the case of this workflow there is a direct correlation between item 'n' in the name list and item 'n' in the id list, be aware that this is a property of this particular workflow and may not hold in general. In this case, however, the resultant spreadsheet is a sensible tool to view the relationship between these outputs.
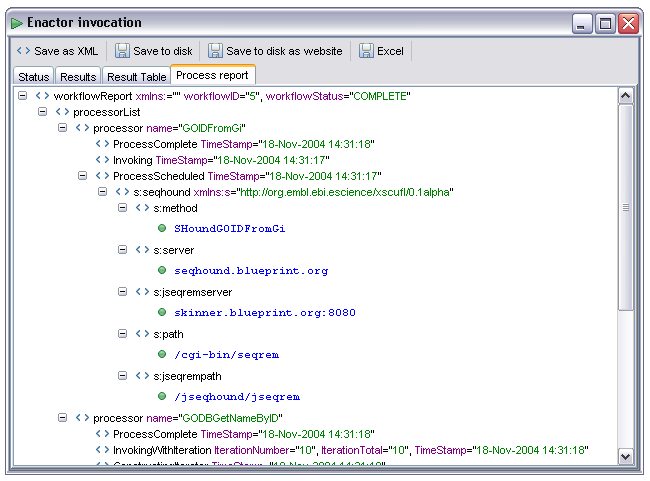
The 'Process report' tab provides a view on the process log for the workflow. This is displayed whether the workflow succeeded or not. For each processor in the workflow a node is created in the log, events are then appended on to this node. The events are the same as those in the status display, with additional information added as child nodes onto the event node concerned. This display is only of interest when debugging workflows, in the event of failures it can potentially show enough information to diagnose the problem. This information, however, is generally not very friendly, it often consists of Java stack traces and error reports directly extracted from the service access plugins. An example of a successful enactment trace is shown below: